
What Are the Top 10 Bus Service Providers Worldwide?
Bus Services shape how millions of people reach work, school, healthcare, and public spaces. A reliable bus is more than a vehicle on a route. It is a driver greeting passengers, a clear timetable at a crowded stop, and a connection that arrives when people need it. Small details matter.
Transit-planning consultant and Human Transit author Jarrett Walker has expressed the idea simply: “Transit is freedom.” That principle offers a useful lens for examining the world’s leading bus providers. Their performance depends not only on fleet size, but also on network coverage, passenger safety, punctuality, affordability, accessibility, and investment in cleaner vehicles. No single measure tells the whole story.
This overview considers ten prominent providers and the different ways they serve passengers. Some operate vast urban networks; others focus on intercity travel, regional links, or technology-led operations. Comparisons require care. Companies report their results differently, and service quality can vary between cities and routes. A polished annual report does not guarantee a smooth ride on a rainy Tuesday. The ranking should therefore be read as a practical guide, not a final verdict. It also leaves room for debate: passenger experience is difficult to reduce to a neat score.
Criteria for Ranking the World’s Leading Bus Service Providers
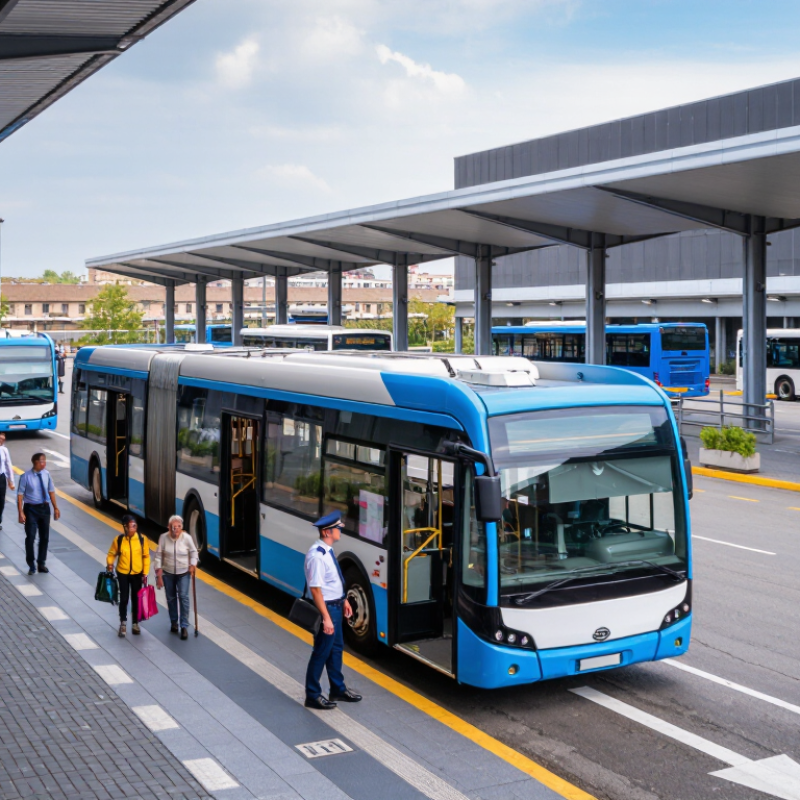
A fair ranking should measure what passengers experience, not just fleet size. Useful indicators include on-time performance, service frequency, canceled trips, safety records, accessibility, and fare affordability. A bus arriving every six minutes matters more than a large fleet parked in a depot. Numbers need context. Compare results across similar city conditions and publish the measurement period, because peak-hour reliability can hide poor evening service. The ITDP BRT Standard offers a practical reference: it assesses bus rapid transit through service planning, infrastructure, and operations, rather than vehicle counts alone.
Environmental performance also deserves a clear, evidence-based score. The IEA’s Global EV Outlook 2024 reports nearly 50,000 electric bus sales worldwide in 2023, showing why fleet emissions and transition plans now matter. Still, electric buses are not automatically cleaner in every operating context; electricity sources, vehicle use, and maintenance affect results. Strong providers should disclose fuel or electricity use per passenger-kilometre, along with accessible-vehicle coverage and customer complaint resolution. Financial resilience matters, too: persistent service cuts can erase impressive punctuality figures. Some data remain inconsistent between cities. A transparent ranking should flag gaps, explain its weighting, and avoid treating estimates as verified performance.
| No. | Ranking Criterion | Suggested Measure | Weight | Why It Matters |
|---|---|---|---|---|
| 1 | Safety performance | Reportable passenger injuries and serious incidents per million vehicle-kilometres, using a consistent reporting period. | 18% | Normalizing incidents by distance helps compare services of different sizes and operating ranges. |
| 2 | Service reliability | Percentage of scheduled trips operated, alongside cancellations and missed trips per 10,000 scheduled journeys. | 15% | A published timetable is useful only when services operate consistently. |
| 3 | On-time performance | Share of trips arriving within a clearly defined time window, reported by route type and time of day. | 12% | Consistent definitions make punctuality figures more meaningful across networks. |
| 4 | Network coverage and frequency | Service-area coverage, scheduled departures, operating hours, and access to major residential and employment areas. | 11% | Broad coverage and useful frequencies improve practical access to bus services. |
| 5 | Passenger experience | Comparable customer-satisfaction survey results, complaint-resolution time, and passenger information availability. | 10% | Passenger feedback and clear travel information reflect the quality of the journey from the customer’s perspective. |
| 6 | Accessibility and inclusion | Share of services meeting applicable accessibility requirements, including step-free boarding and accessible passenger information. | 9% | Accessible vehicles, stops, and information help more people use public transport independently. |
| 7 | Environmental performance | Operational greenhouse-gas emissions per vehicle-kilometre or passenger-kilometre, with the calculation boundary disclosed. | 8% | A defined emissions measure supports transparent comparison of operational impacts. |
| 8 | Fleet condition and availability | Fleet availability, preventive-maintenance completion, and the proportion of scheduled service delivered without vehicle-related disruption. | 6% | Well-maintained vehicles support dependable operations and reduce avoidable service interruptions. |
| 9 | Value and affordability | Fare options and fare changes considered alongside service levels, with local income and purchasing-power context stated. | 6% | Affordability comparisons require context because fares, incomes, and public subsidies vary by location. |
| 10 | Transparency and governance | Availability of audited or independently verified performance data, clear service standards, and regular public reporting. | 5% | Transparent, consistently defined data make performance claims easier to verify. |
Method note: The weights above are a proposed evaluation framework, not measured results for individual operators. A credible worldwide ranking should compare providers only when data use comparable definitions, reporting periods, and operating contexts.
Related Posts
-
China Top Bus Services Suppliers for Global Buyers?
-
Essential Tips for Efficient Bus Transportation Worldwide?
-

10 Ultimate Travel Bus Rental Options for Global Buyers
-

Understanding Travel Bus Rental: A Comprehensive Guide to Rental Options and Benefits
-

Common Issues with Coach Bus Rental Services
-
Explore the Freedom of Journey: Affordable Tour Bus Rental Services for Your Next Adventure!